Tools for creating charts, maps, and diagrams
I recently taught a 1/2 day workshop at WebSearch University in Washington DC on Visualization Tools for Turning Information Into Insights. At a conference that basically focuses on the search, my workshop covered delivering your results in a way that’s meaningful for clients.
Our clients don’t crave more or better info. They’re drowning in it and turn to info pros to help them gather insights – information that answers their questions (even the ones they didn’t ask) and facilitates decision-making.
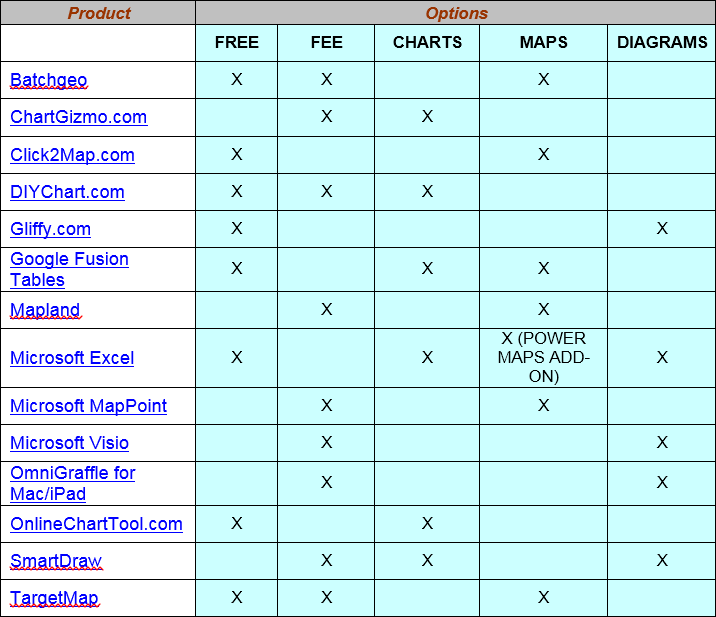
Charts, maps, and diagrams take numbers and concepts and turn them them into at-a-glance insights. In recent posts, I’ve shared some tips for selecting and creating these kinds of information graphics. But now what? What tools can you use to create visuals for information deliverables?
There are lots , but here’s a short list I shared in my workshop. To be included on the list, the tool must be:
1. Easy-to-use
2. Free or low-cost
3. Used to create simple visualizations in client deliverables, committee reports, etc. – not for data visualization projects
Let me know what you’re using, and I can add it to the list!


